Content analysis
Content analysis reports provide comprehensive insights into the effectiveness and performance of various content types within a given platform. The reports are structured into several key components that help stakeholders understand content dynamics, user engagement, tagging efficiency, and overall trends in content performance. This document explains how to read the content analysis report.
Access the dashboard
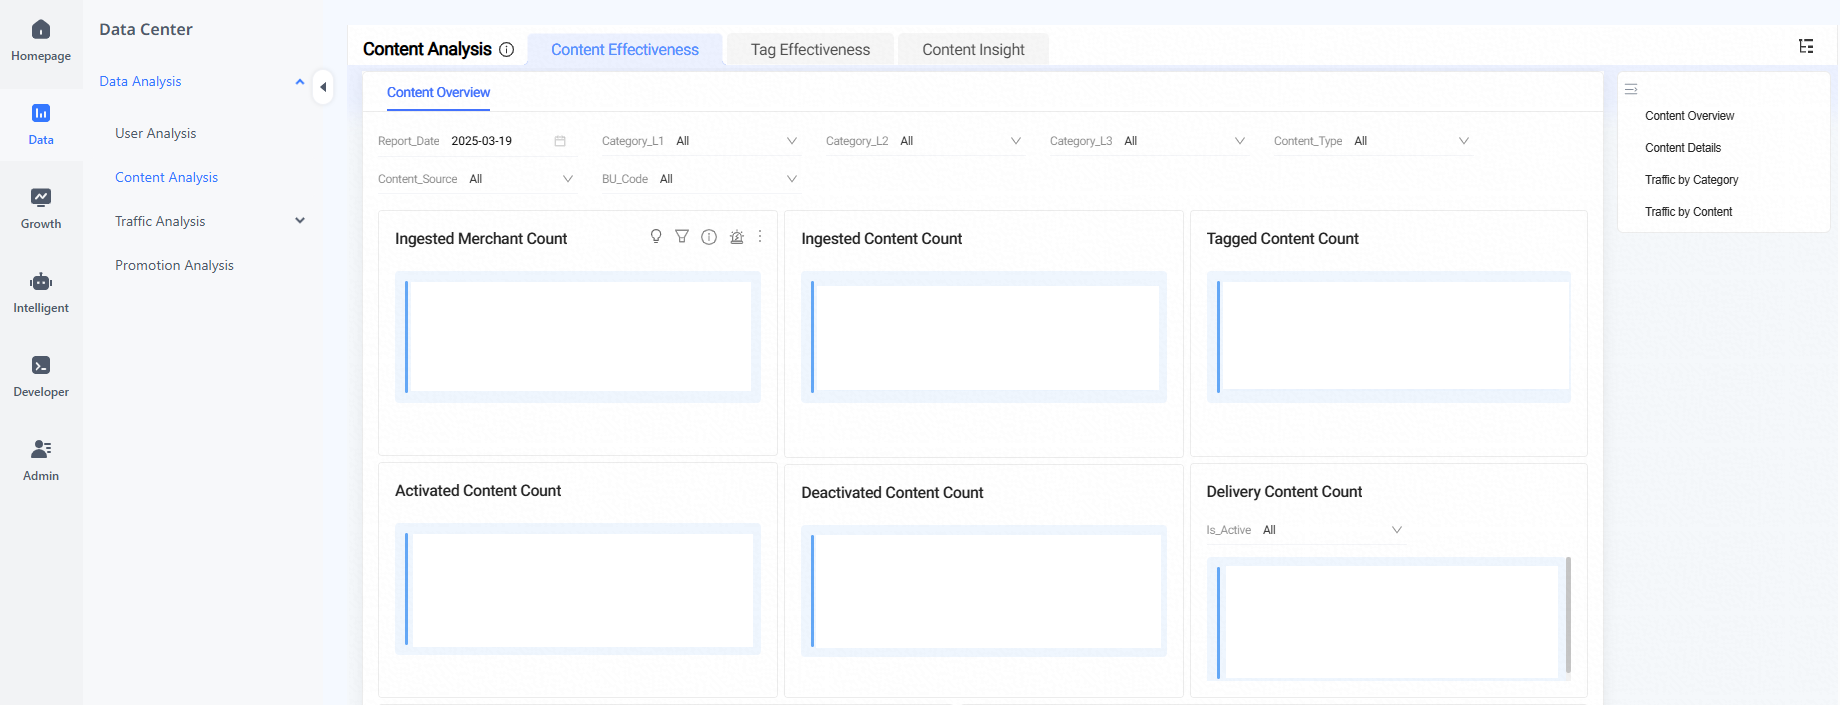
Go to Data Center> > Data Analysis > Content Analysis to access the dashboard.
Core metrics overview
Component | Metric | Description | Filter & Dimension | Format |
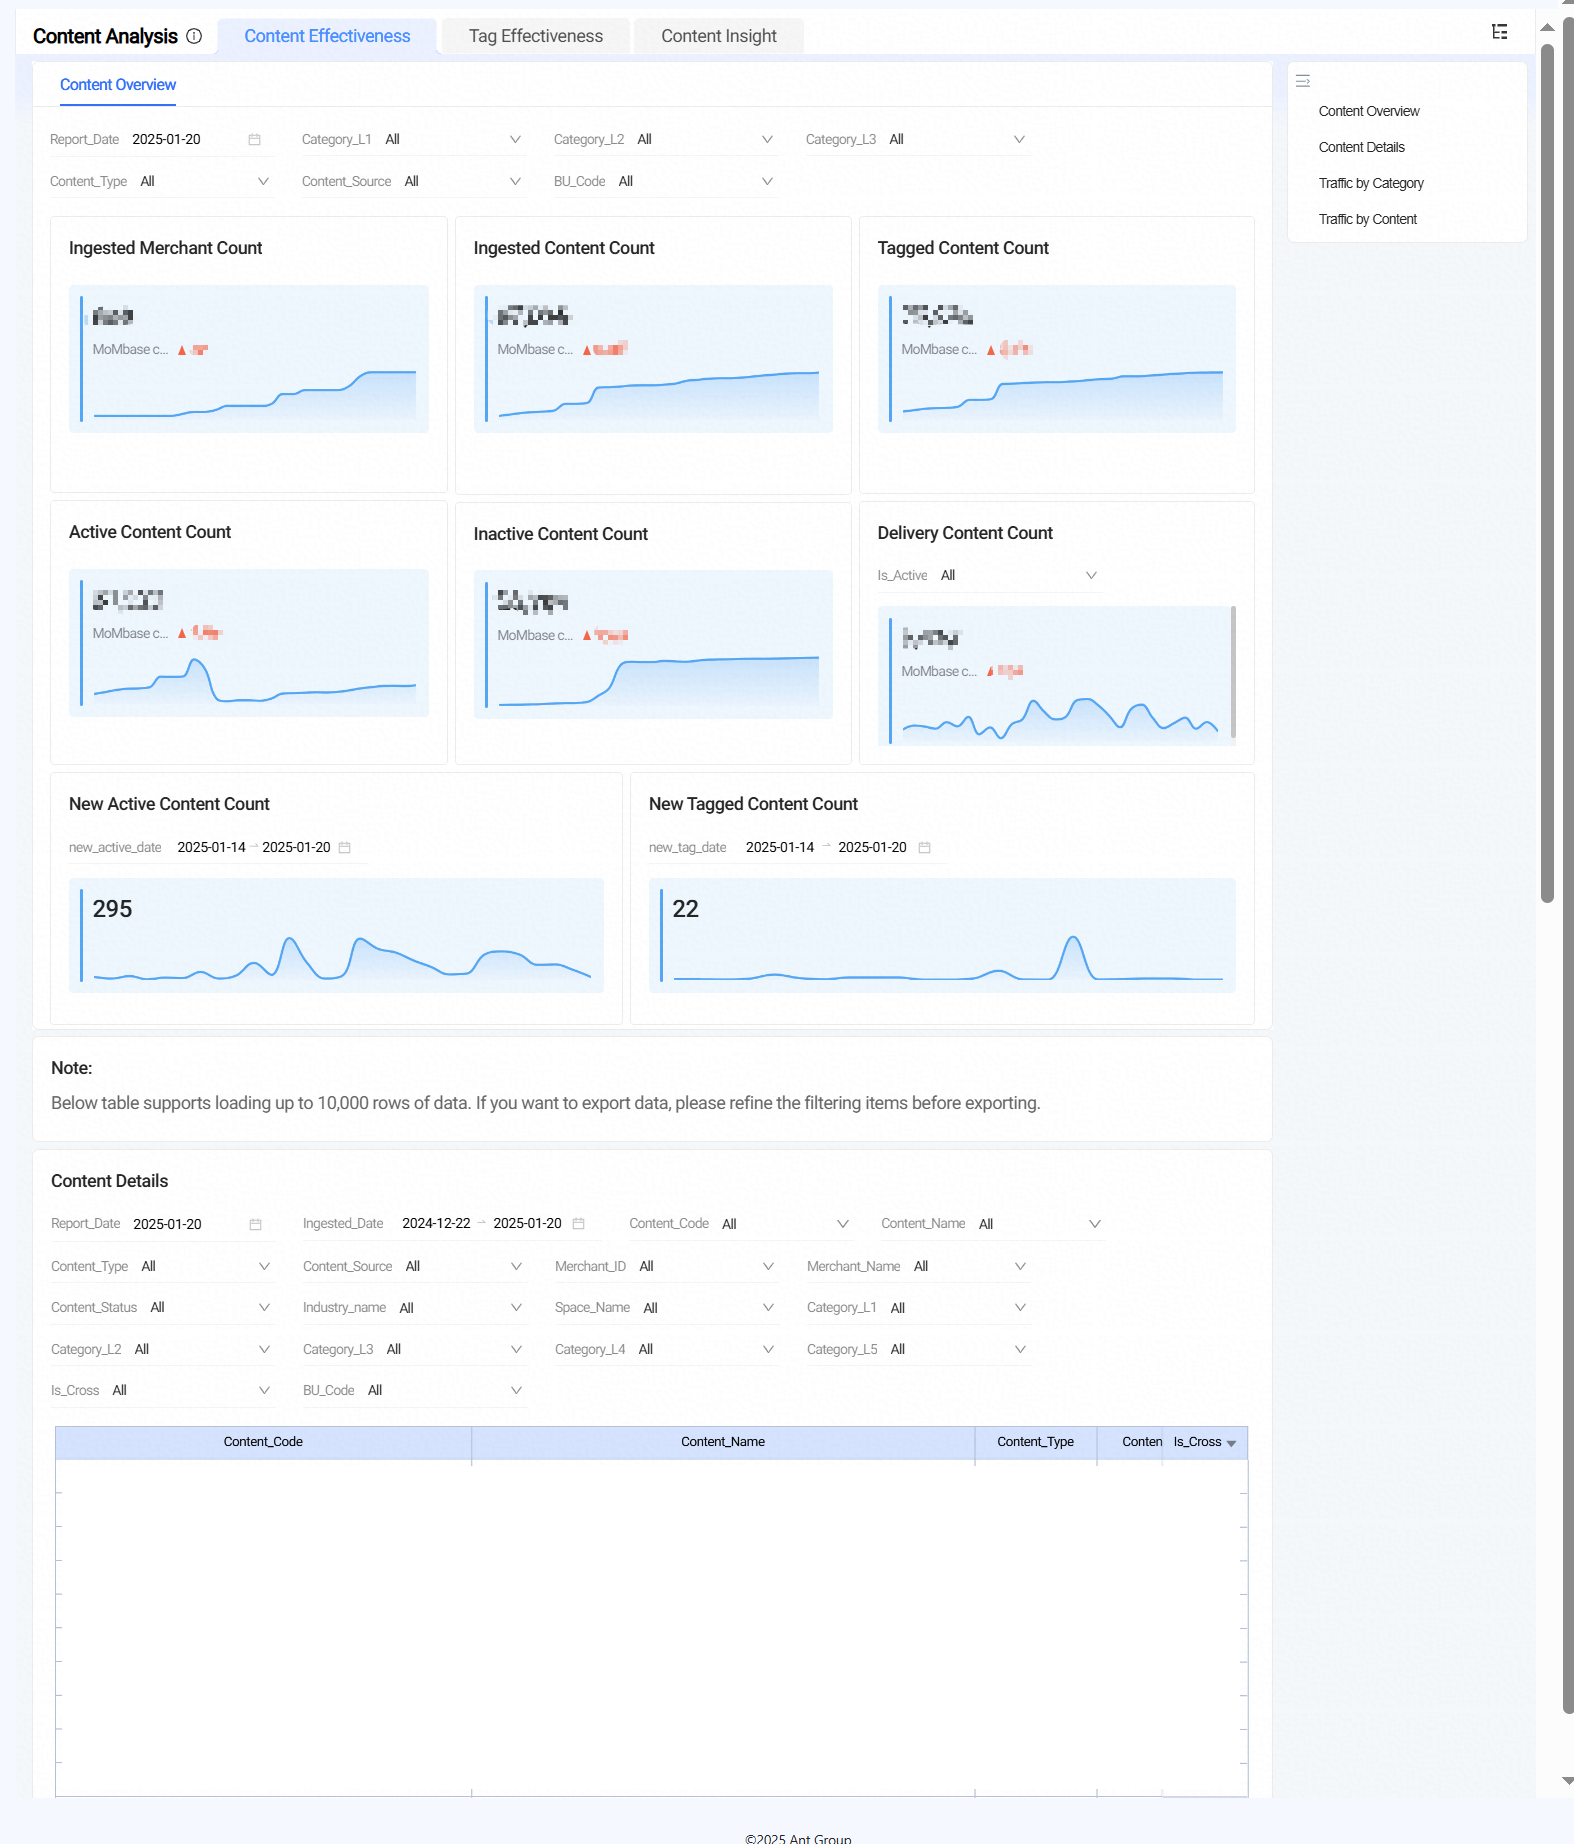
Content Effectiveness - Content Overview | Ingested Merchant Count | The total number of unique merchants which was ingested. (Cumulative value, Content_Type = 'MERCHANT') | Report Date: Single calendar box, default to yesterday.
| Metric Card: Value, MoM different value, Mini trend chart (Last 30 days) |
Ingested Content Count | The total number of unique content that was ingested. (Cumulative value) | |||
Tagged Content Count | The total number of unique content which was tagged (Cumulative value), including:
| |||
Active Content Count | The total number of unique content that was active. (Cumulative value) | |||
Deactivated Content Count | The total number of unique content that was deactivated. (Cumulative value) | |||
Delivery Content Count | The total number of unique contents delivered (daily value), including content library and static creative elements. | |||
New Active Content Count | The total number of unique content with active time during the specified period (default T-7~T-1) includes both initially activated and later activated content. (Daily value)
| |||
New Tagged Content Count | The total number of unique content with the tagging time during the specified period (default T-7~T-1), including first and non-first tagged content. (Daily value)
| |||
Month-over-month Comparison Different Value | Value change compared to the previous month. | |||
Content Effectiveness - Content Details | None, all are the content dimension details | The description of some dimensions is as follows:
| Report Date: Single calendar box, default to yesterday | Cross Table |
Content Effectiveness - Traffic by Category | Exposures PV | The total number of times the content was displayed to users during a specific period. | Report Date: Single calendar box, default to yesterday | Cross Table |
Exposures UV | The total number of unique visitors who have viewed the content during a specific period. | |||
Clicks UV | The total number of unique visitors who have clicked on the content during a specific period. | |||
UVCTR (Unique Visitors Click-Through Rate) | Calculated as Clicks UV / Exposures UV * 100%, formatted to two decimal places. | |||
Month-over-Month Comparison Rate | The percentage change compared to the previous month. | |||
r1d | Exposures PV, Exposures UV, Clicks UV, UVCTR, Month-over-Month (MoM) rate for recent 1 day. | |||
r7d | Exposures PV, Exposures UV, Clicks UV, UVCTR, MoM rate for the recent 7 days. | |||
r30d | Exposures PV, Exposures UV, Clicks UV, UVCTR, MoM rate for the recent 30 days. | |||
Content Effectiveness - Traffic by Content | Exposures PV | The total number of times the content was displayed to users during a specific period. | Report Date: Single calendar box, default to yesterday | Cross Table |
Exposures UV | The total number of unique visitors who have viewed the content during a specific period. | |||
Clicks UV | The total number of unique visitors who have clicked on the content during a specific period. | |||
UVCTR (Unique Visitors Click-Through Rate) | Calculated as Clicks UV / Exposures UV * 100%, formatted to two decimal places. | |||
Month-over-Month Comparison Rate | The percentage change compared to the previous month. | |||
r1d | Exposures PV, Exposures UV, Clicks UV, UVCTR, MoM rate of the recent 1 day. | |||
r7d | Exposures PV, Exposures UV, Clicks UV, UVCTR, MoM rate of the recent 7 days. | |||
r30d | Exposures PV, Exposures UV, Clicks UV, UVCTR, MoM rate of the recent 30 days. | |||
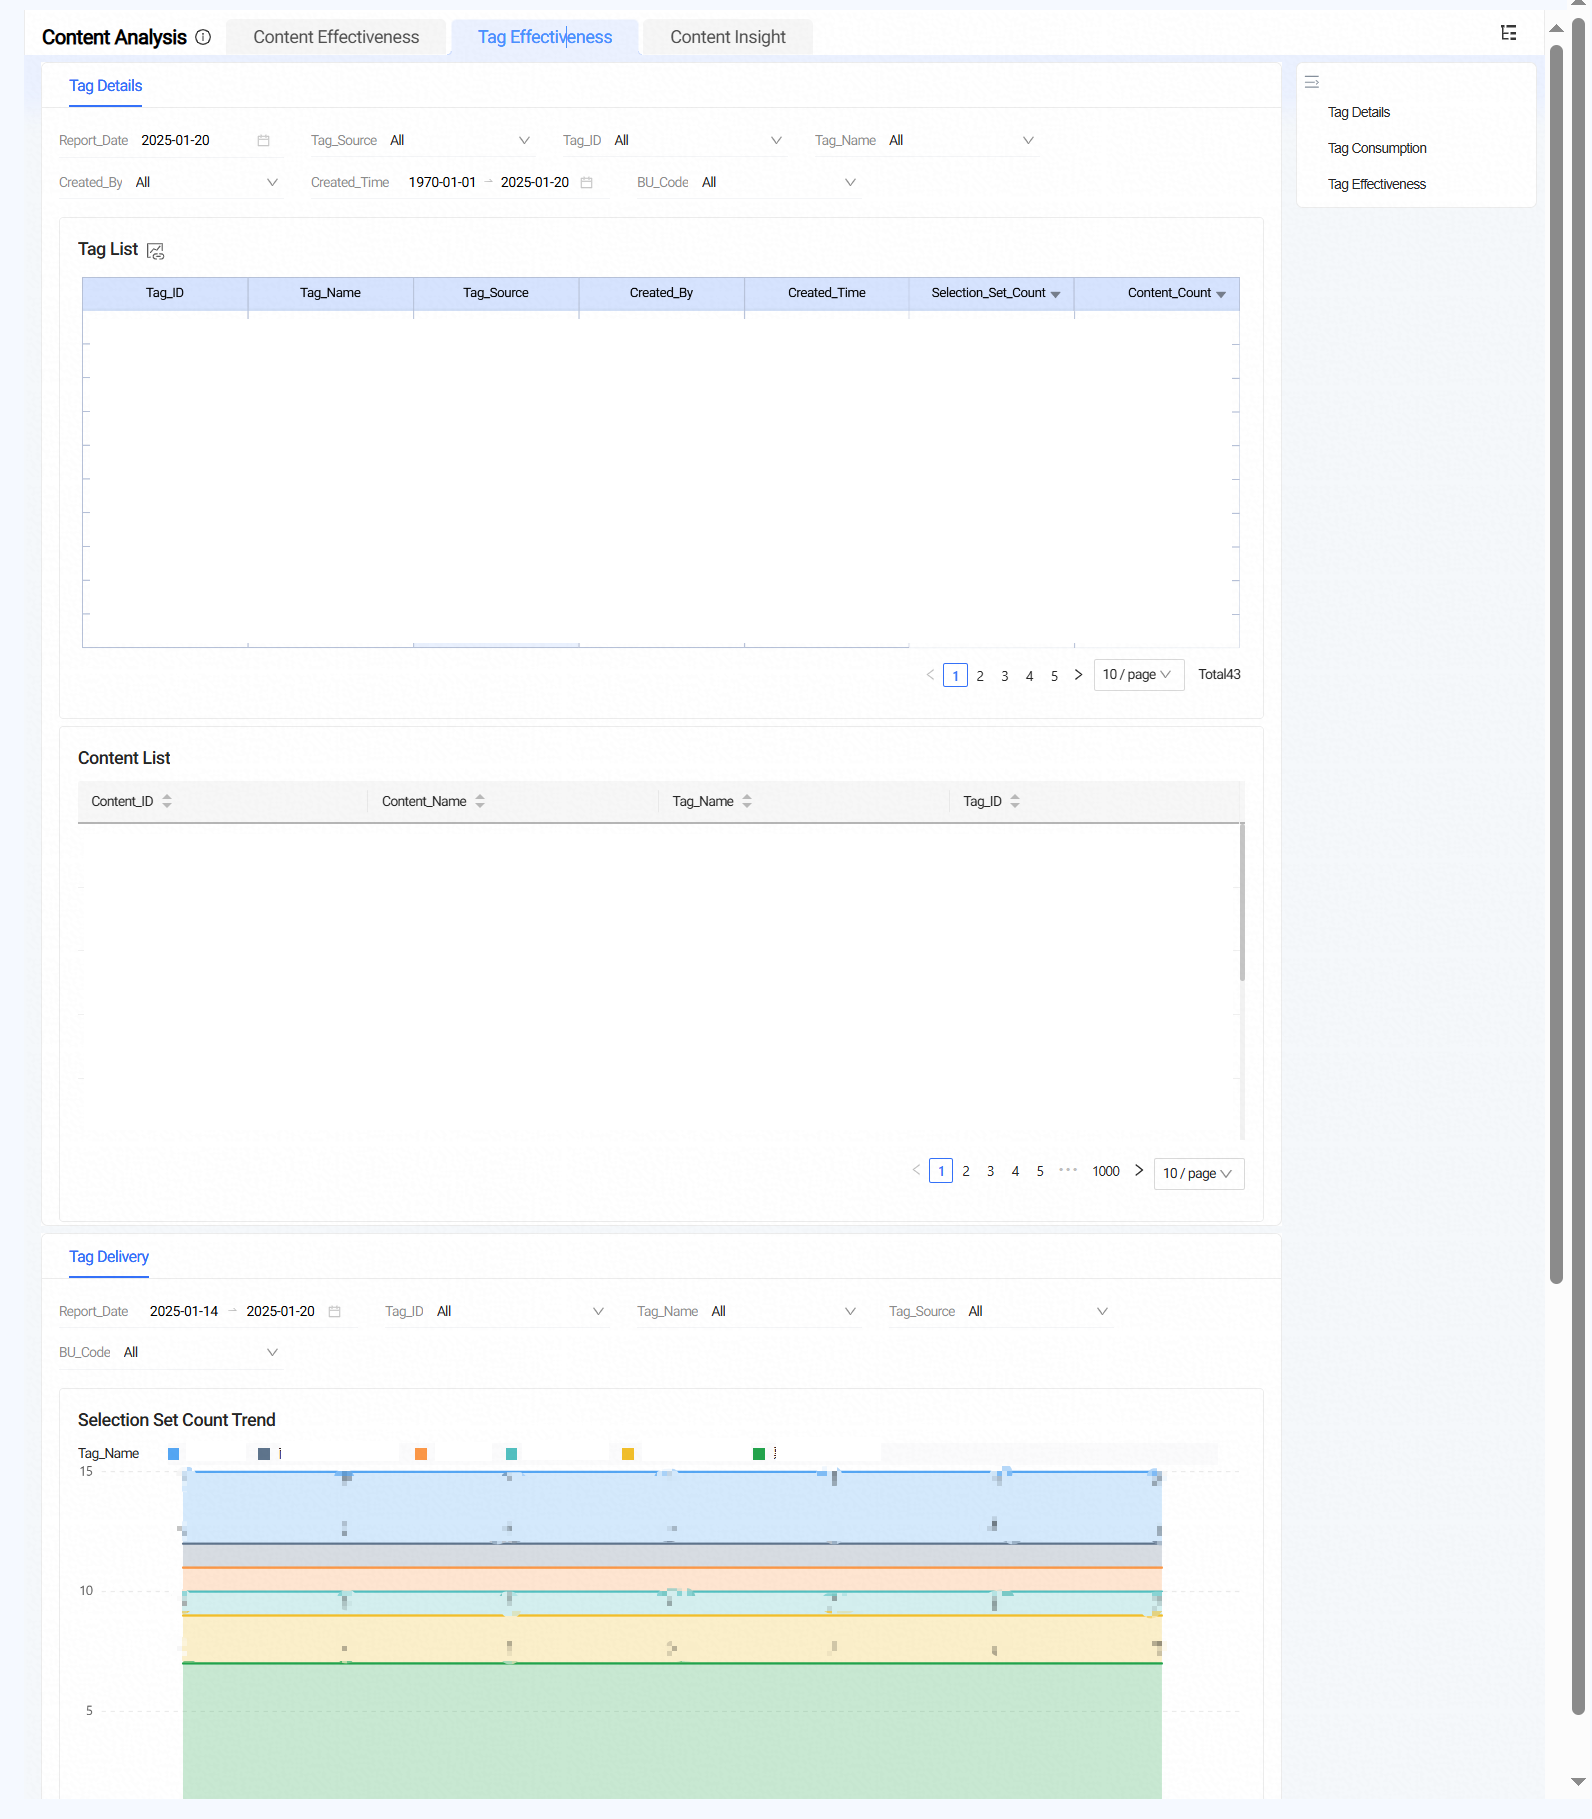
Tag Effectiveness - Tag Details | SelectionSet Count | The total number of unique selection sets associated with tags. | Report Date: Single calendar box, default to yesterday | Cross Table |
Content Count | The number of contents labeled with this tag. | |||
Tag Effectiveness - Tag Delivery | Selection Set Count Trend | The total number of unique selection sets associated with tags during the specified period (default T-7~T-1). (Daily value) | Report Date: Cross-calendar box, default to T-7~T-1 | Metric Card: Mini trend chart (Last 7 days) |
Tag Effectiveness - Tag Effectiveness | Exposures PV | The total number of times that the selection set with the selected tag was displayed to users during a specific period. | Report Date: Single calendar box, default to yesterday | Cross Table |
Exposures UV | The total number of unique visitors who have viewed the selection set with the selected tag during a specific period. | |||
Clicks UV | The total number of unique visitors who have clicked the selection set with the selected tag during a specific period. | |||
UVCTR (Unique Visitors Click-Through Rate) | Calculated as Clicks UV / Exposures UV * 100%, formatted to two decimal places. | |||
Month-over-Month Comparison Rate | Percentage change compared to the previous month. | |||
r1d | Exposures PV, Exposures UV, Clicks UV, UVCTR, MoM rate of the recent 1 day. | |||
r7d | Exposures PV, Exposures UV, Clicks UV, UVCTR, MoM rate of the recent 7 days. | |||
r30d | Exposures PV, Exposures UV, Clicks UV, UVCTR, MoM rate of the recent 30 days. | |||
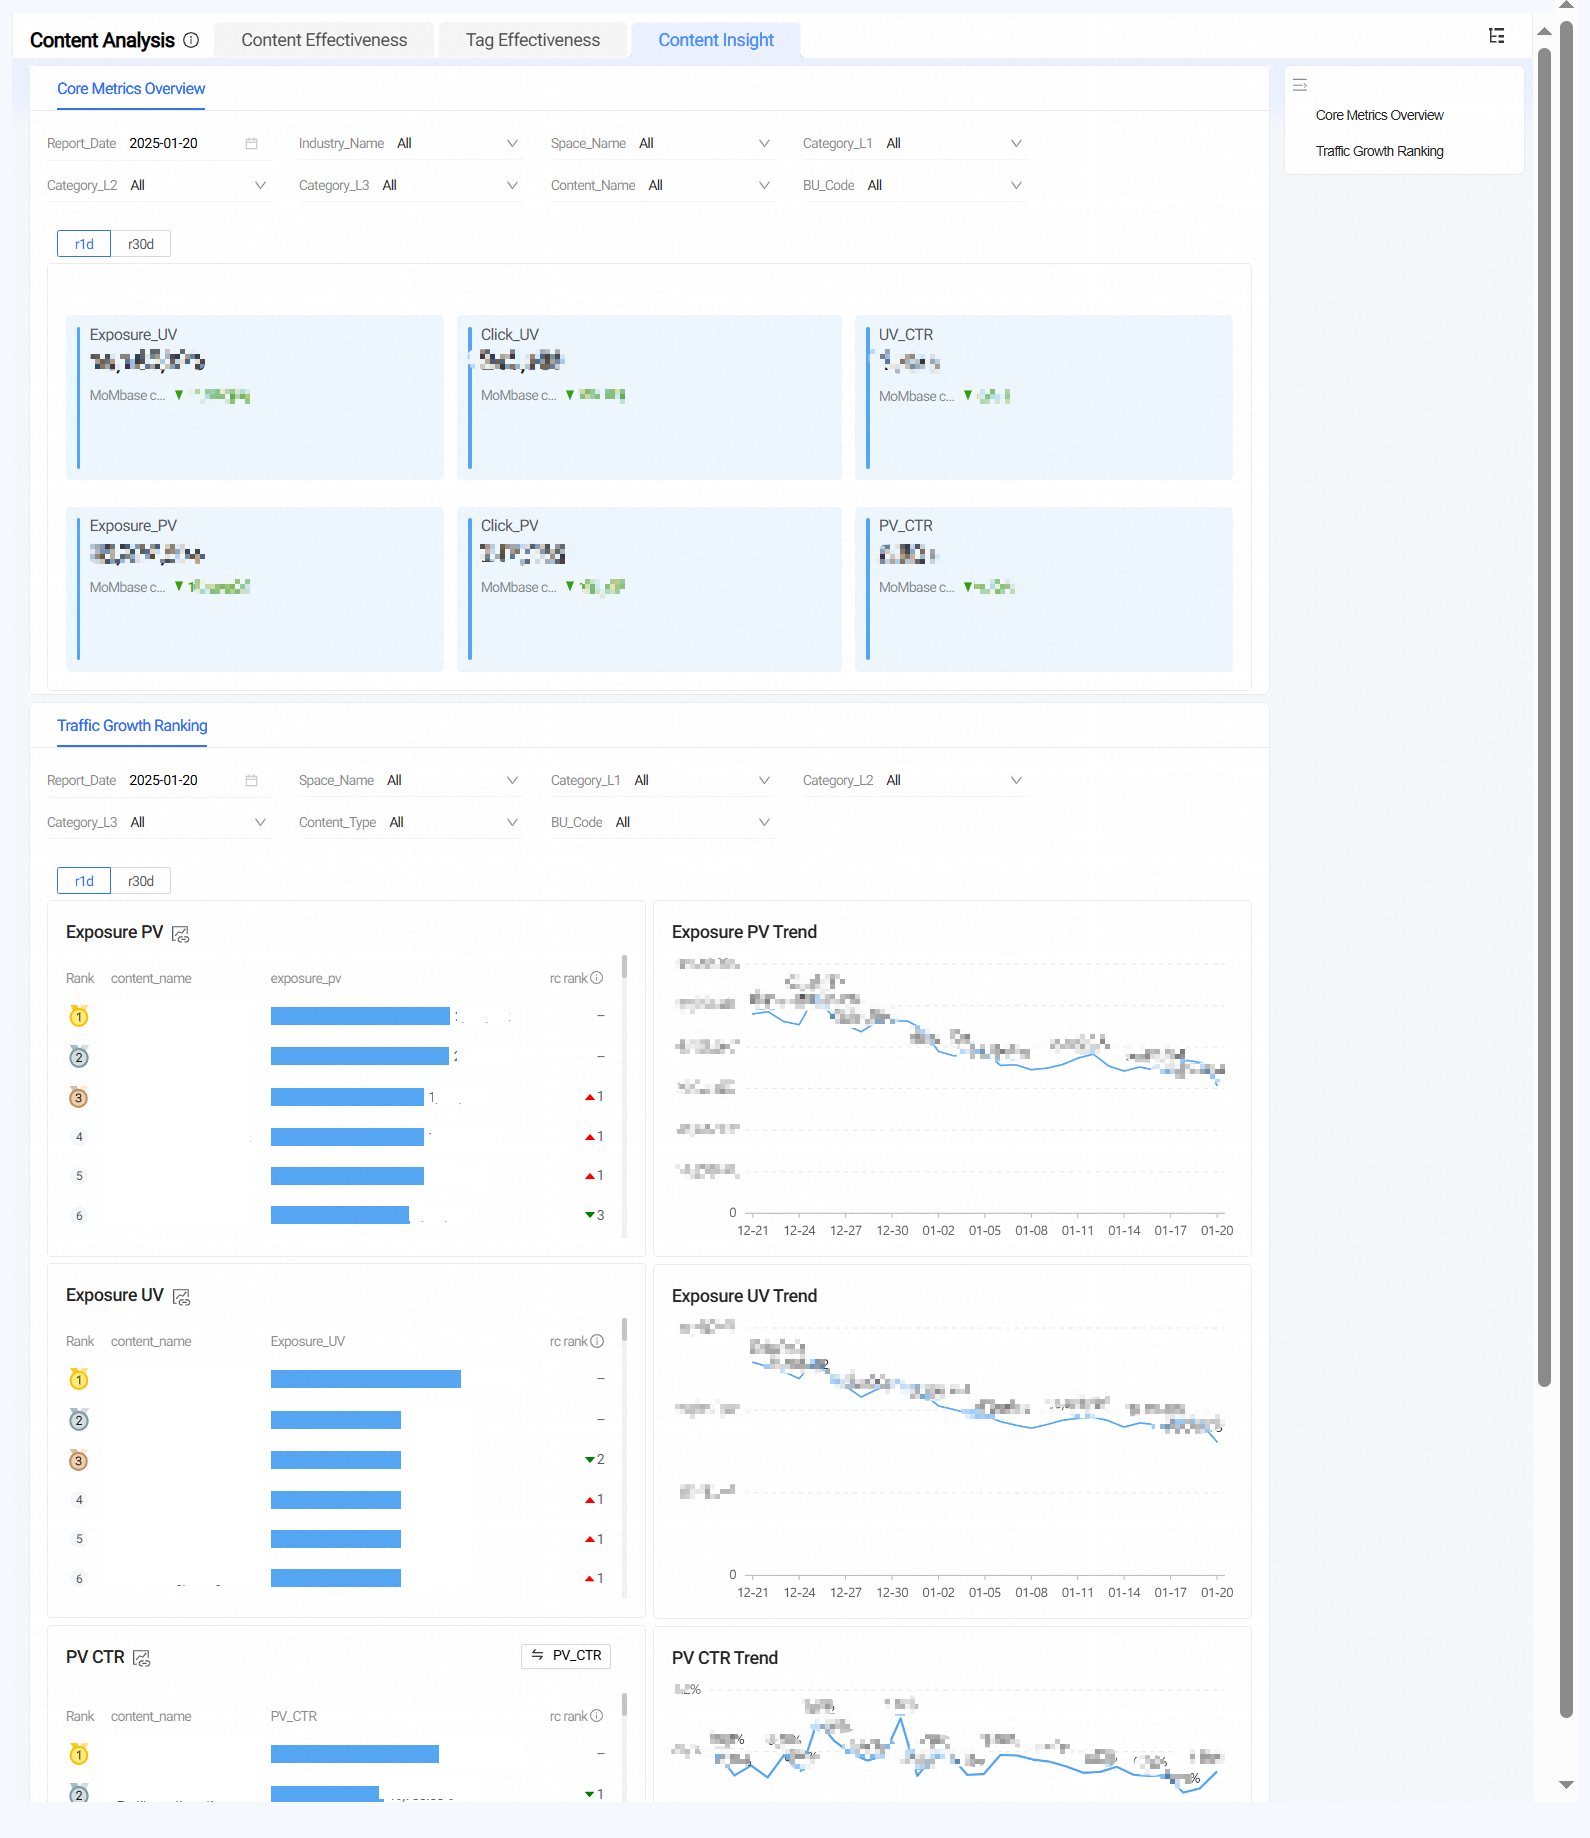
Content Insight - Core Metrics Overview | Exposures PV | The total number of times that the label was displayed to users during a specific period. | Report Date: Single calendar box, default to yesterday | Metric Card: Value, MoM different value |
Clicks PV | The total number of times that users have clicked the label during a specific period. | |||
PVCTR (Page Views Click-Through Rate) | Calculated as Clicks UV / Exposures UV * 100%, formatted to two decimal places. | |||
Exposures UV | The total number of unique visitors who have viewed the content during a specific period. | |||
Clicks UV | The total number of unique visitors who have clicked to the content during a specific period. | |||
UVCTR (Unique Visitors Click-Through Rate) | Calculated as Clicks UV / Exposures UV * 100%, formatted to two decimal places. | |||
Month-over-month Comparison Different Value | Value change compared to the previous month. | |||
r1d | Exposures PV, Clicks PV, PVCTR, Exposures UV, Clicks UV, UVCTR, Month-over-month (MoM) Comparison Different Value of the recent 1 day. | |||
r30d | Exposures PV, Clicks PV, PVCTR, Exposures UV, Clicks UV, UVCTR, Month-over-month Comparison Different Value of the recent 30 days. | |||
Content Insight - Traffic Growth Ranking | Exposures PV Ranking | Ranking based on exposure PV of different contents during a specific period; Ranking change compared to the previous month. | Report Date: Single calendar box, default to yesterday | Metric Card: Ranking List, Trend Chart |
Exposures UV Ranking | Ranking based on exposure UV of different contents during a specific period; Ranking change compared to the previous month. | |||
PVCTR Ranking | Ranking based on PVCTR of different contents during a specific period; Ranking change compared to the previous month. | |||
UVCTR Ranking | Ranking based on UVCTR of different contents during a specific period; Ranking change compared to the previous month. | |||
r1d | Exposures PV, Exposures UV, PVCTR, UVCTR, Ranking, Ranking change compared to the previous month of the recent 1 day. | |||
r30d | Exposures PV, Exposures UV, PVCTR, UVCTR, Ranking, Ranking change compared to the previous month of the recent 30 days. | |||
Exposures PV Trend | Time series chart of Exposures PV, fixed display from T-31 to T-1. (Daily value) | |||
Exposures UV Trend | Time series chart of Exposures UV, fixed display from T-31 to T-1. (Daily value) | |||
PVCTR Trend | Time series chart of PVCTR, fixed display from T-31 to T-1. (Daily value) | |||
UVCTR Trend | Time series chart of UVCTR, fixed display from T-31 to T-1. (Daily value) |
Sample views
Content effectiveness
Tag effectiveness
Content insight