Traffic analysis
The traffic dashboard offers two key insights: a summary of page views and visitors, and an in-depth analysis of user behaviors, including exposures, clicks, and click-through rates (CTR) categorized by SPM name and space name. This tool helps you understand user activity and assess the performance of display spaces, finding main traffic drivers and areas for improvement.
Access the dashboard
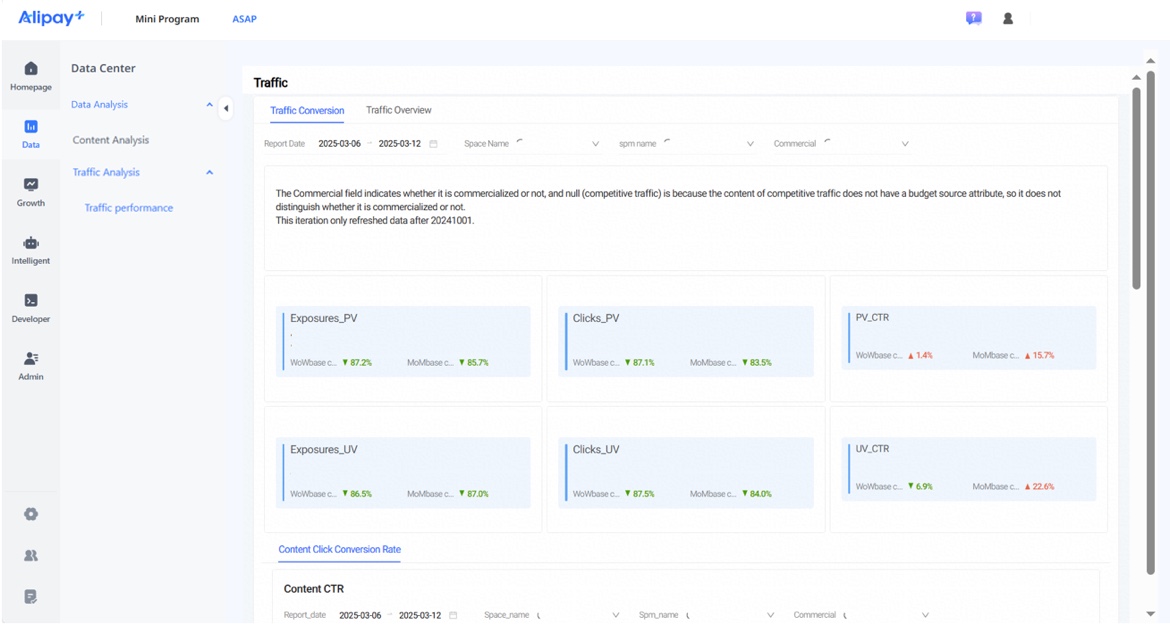
Go to Data Center > Data Analysis > Traffic Analysis > Traffic Performance to access the dashboard.
Core metrics overview
Component | Metric | Description | Filter & Dimension |
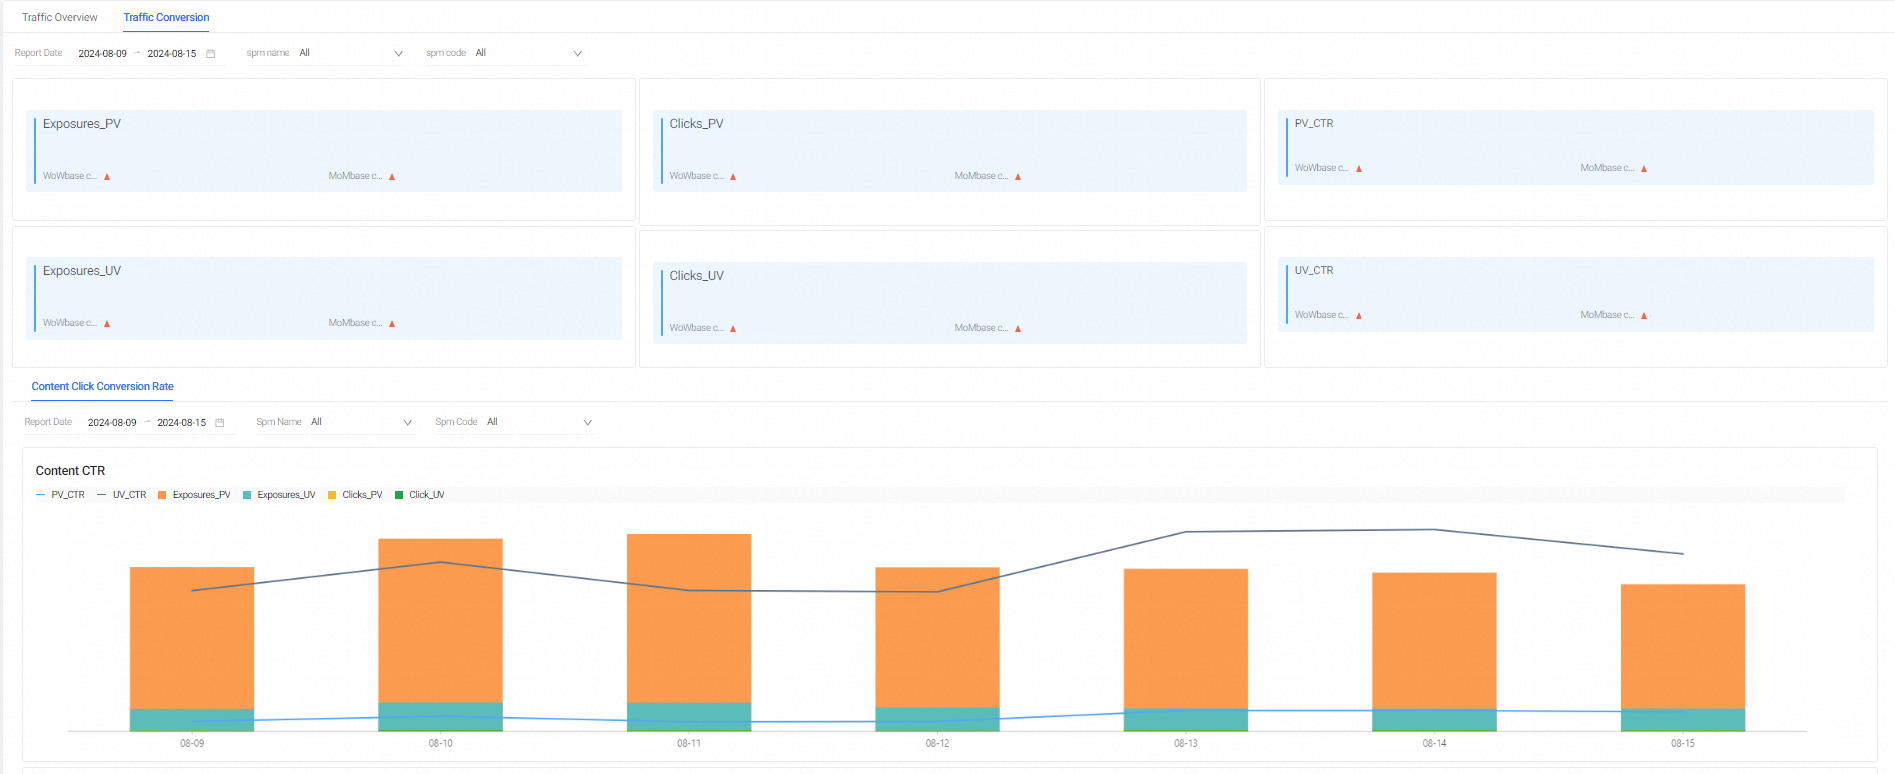
Traffic Conversion | Exposures_PV | Total views of the advertising module. |
|
Clicks_PV | Total clicks on the advertising module. | ||
PV_CTR | Calculate as (Clicks_PV / Exposures_PV) * 100%. | ||
Exposures_UV | Unique visitors who viewed the advertising module. | ||
Clicks_UV | Unique visitors who clicked on the advertising module. | ||
UV_CTR | Calculate as (Clicks_UV / Exposures_UV) * 100%. | ||
(UV, PV, PV_CTR, UV_CTR) | Change percentage compared to the previous week. | ||
(UV, PV, PV_CTR, UV_CTR) | Change percentage compared to the previous month. | ||
Content UV_CTR | Time series chart of Exposure_PV, Exposure_UV, Clicks_PV, Clicks_UV, PV_CTR, UV_CTR. | ||
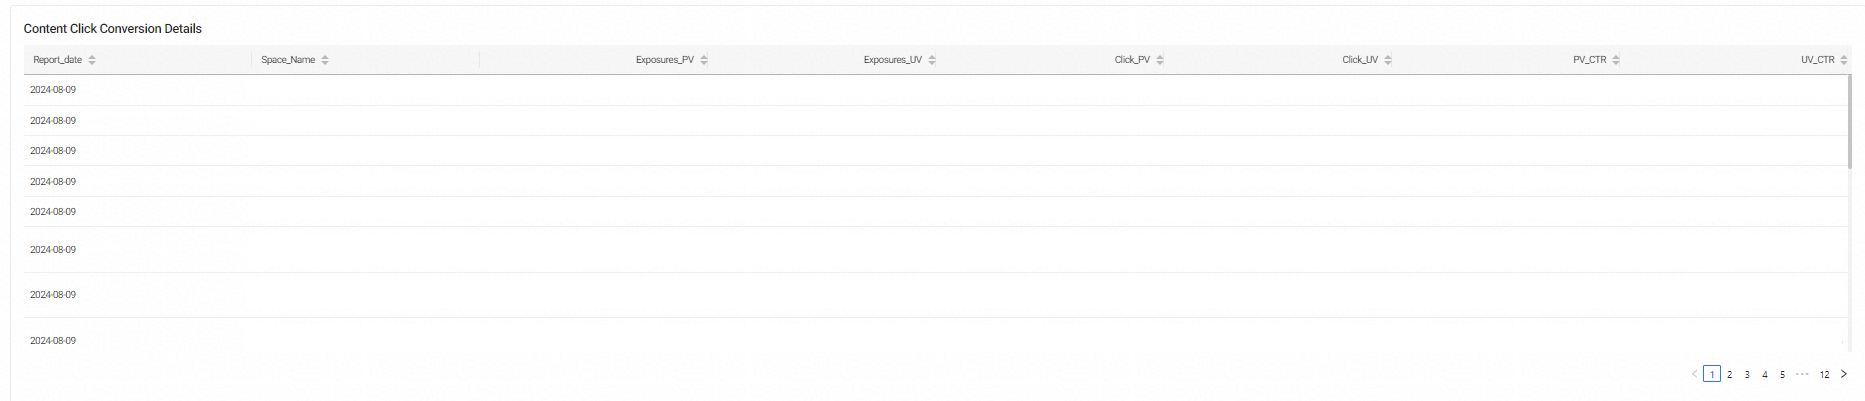
Content Click Conversion Details | Exposure_PV, Exposure_UV, Clicks_PV, Clicks_UV, PV_CTR, UV_CTR based on report date, display space name. |
| |
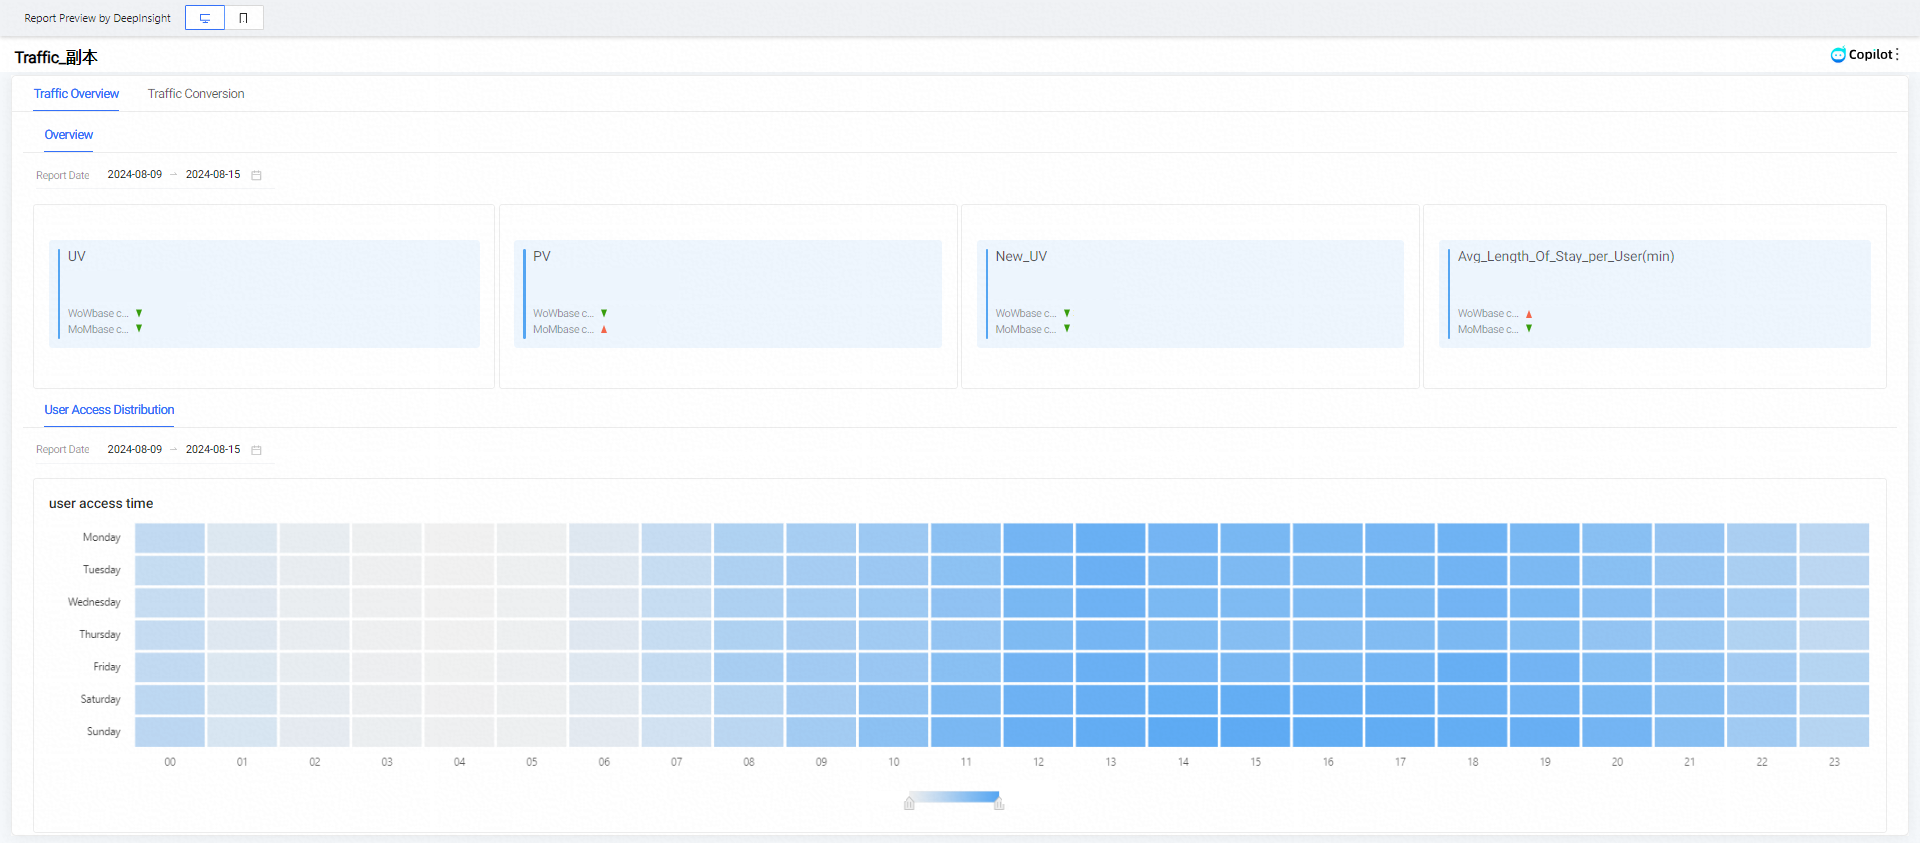
Traffic Overview | UV (Unique Visitors) | Total unique visitors within a specific time. |
|
PV (Page Views) | Total page views within a specific time. | ||
New UV | Unique visitors who first visited within the last 30 days. | ||
Avg Length of Stay per User - min | The average duration of a user session in minutes. | ||
(UV, PV, New UV, Avg Length of Stay per User) | Change percentage compared to the previous week. | ||
(UV, PV, New UV, Avg Length of Stay per User) | Change percentage compared to the previous month. | ||
User Access Distribution | Tracks unique visitor distribution over a 7x24-hour period to identify peak visit times. |
Sample views
Traffic overview sample
Traffic conversion sample