User Experience
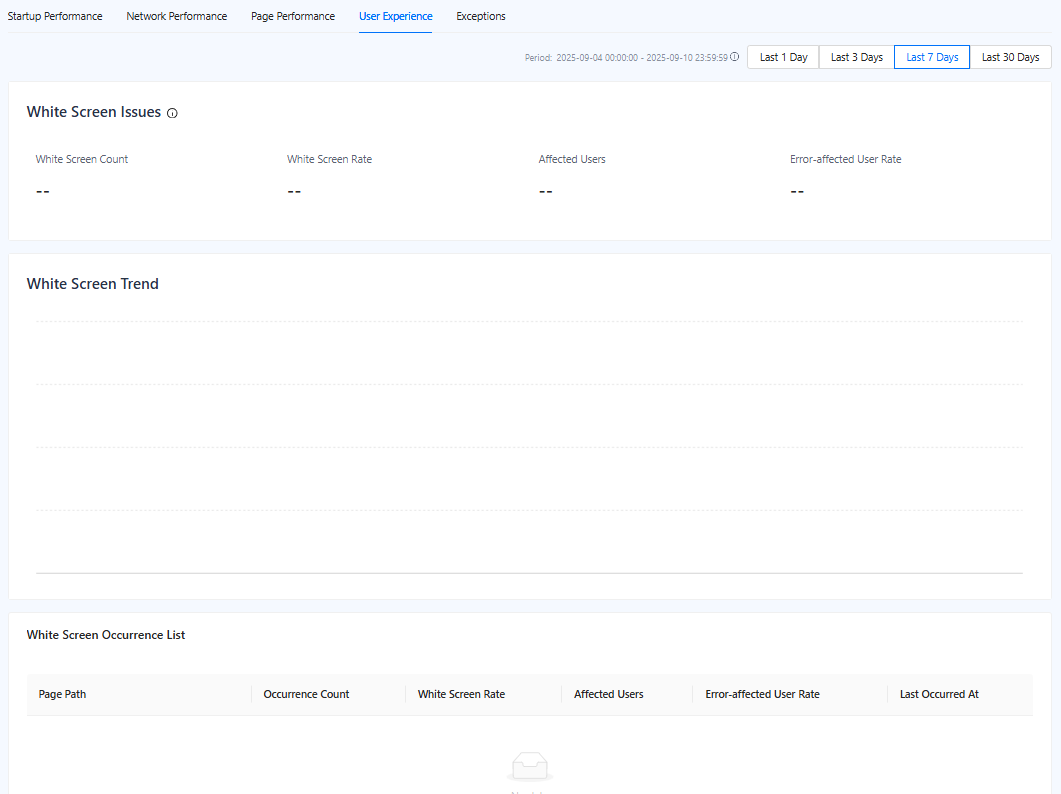
The User Experience tab focuses on the user experience of the mini program, especially the impacts of white screen issues. A white screen is one of the most critical errors a user can encounter, as it completely halts their journey and can lead to immediate abandonment.
This page is designed to help you identify, analyze, and resolve white screen issues in your mini programs. By tracking key metrics, you can pinpoint problematic pages, understand their severity, and take action to improve user experience.
You can filter data by time range (last 1/3/7/30 days).

Figure 1. User Experience
White Screen Issues
This section displays a set of metrics that provide a high-level, at-a-glance summary of white screen incidents. A white screen is a critical error where a page fails to render any content, leaving the user staring at a blank screen.
- White Screen Count
- The total number of white screen occurrences across all users and pages.
- This is a direct measure of the overall volume of white screen issues. A sudden spike in this number is a clear signal of a new or worsening issue, often following a new release.
- White Screen Rate
- The percentage of total page views (PV) that resulted in a white screen. It's calculated as: White Screen Count/Total PVs.
- This rate helps you understand the issue's severity relative to your traffic.
- Affected Users
- The number of unique visitors (UV) who encountered at least one white screen occurrence.
- This metric measures the breadth of the issue's impact. It helps you distinguish between a problem affecting a single user many times and a widespread problem affecting a large portion of your user base.
- Error-affected User Rate
- The percentage of total UVs affected by white screen issues. It's calculated as: Affected Users/Total UVs.
- This is the measure of user impact. It helps you identify the percentage of the active user base that experienced the white screen issue.
White Screen Trend
This trend chart visualizes the user experience metrics tracked over the specified time period. This visualization provides comprehensive insights into the white screen issue characteristics.
You can use the trend chart to track changes in user experience metrics and monitor the trend over the specified period of time. You can also use the trend chart to see how metrics influence each other.
White Screen Occurrence List
This list displays the detailed information about white screen occurrences. You can use this table to locate pages where a white screen occurs and perform debugging.
- Page Path: The identifier for the specific page where the white screen error occurred.
- Occurrence Count: Total white screen occurrences on this specific page.
- White Screen Rate: The rate of white screen occurrences on this page. It is calculated as: Occurrence Count/Total PVs of this page.
- Affected Users: The number of UVs who experience a white screen on this page.
- Error-affected User Rate: The rate of users who experienced a white screen on this page. It is calculated as: Affected Users/Total UVs of this page.
- Last Occurred At: The most recent time when the white screen issue occurred. This helps you confirm if the issue is still actively occurring.