Exceptions
The Exceptions page is designed to help you proactively detect, diagnose, and resolve errors occurred in your mini programs, including JavaScript errors, resource loading failures, and failed HTTP requests.
This topic describes metrics in the Exceptions page and helps you to locate errors.
Real-time vs. Offline Data
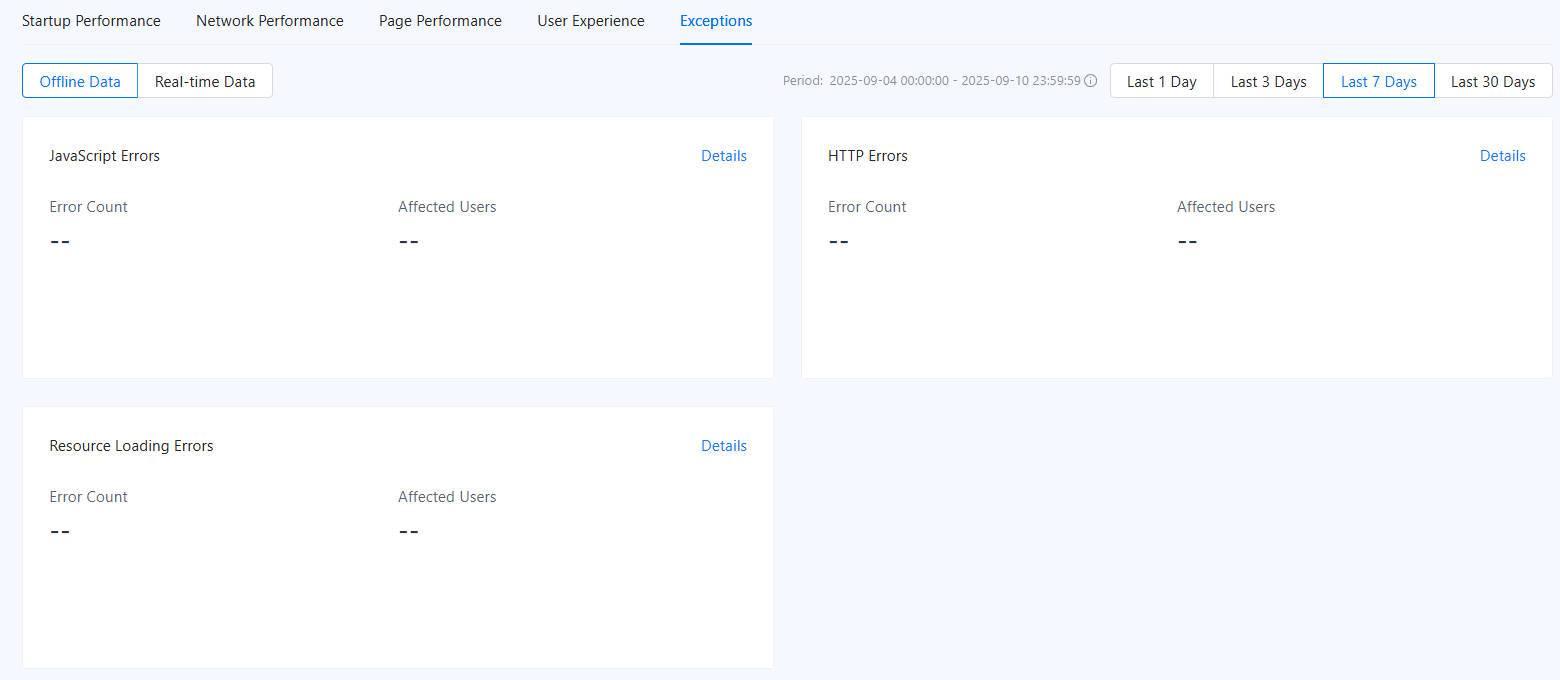
This dashboard provides data in two modes. You can switch between real-time and offline data mode:
- Offline Data: This mode provides aggregated data from the previous day. It is ideal for trend analysis and historical review. In this mode, each metric includes a day-over-day comparison. In offline mode, you can select a period of time (last 1/3/7/30 days) to view data in the corresponding period.
- Real-time Data: This mode shows data in real time. It is perfect for active incident monitoring. It does not include historical comparisons or custom date ranges.
Exception categories
This page displays metrics of the following types of exceptions: JavaScript errors, HTTP errors, and resource loading errors. You can click Details in a card to view the metrics of the corresponding error type.
In the displayed cards, error count and affected users of each type of exception are provided to give you an overview of the severity of each type of exception. A line graph that visualizes how error metrics have changed over the selected time period is provided in each error type card.

Figure 1. Exceptions
JavaScript Errors
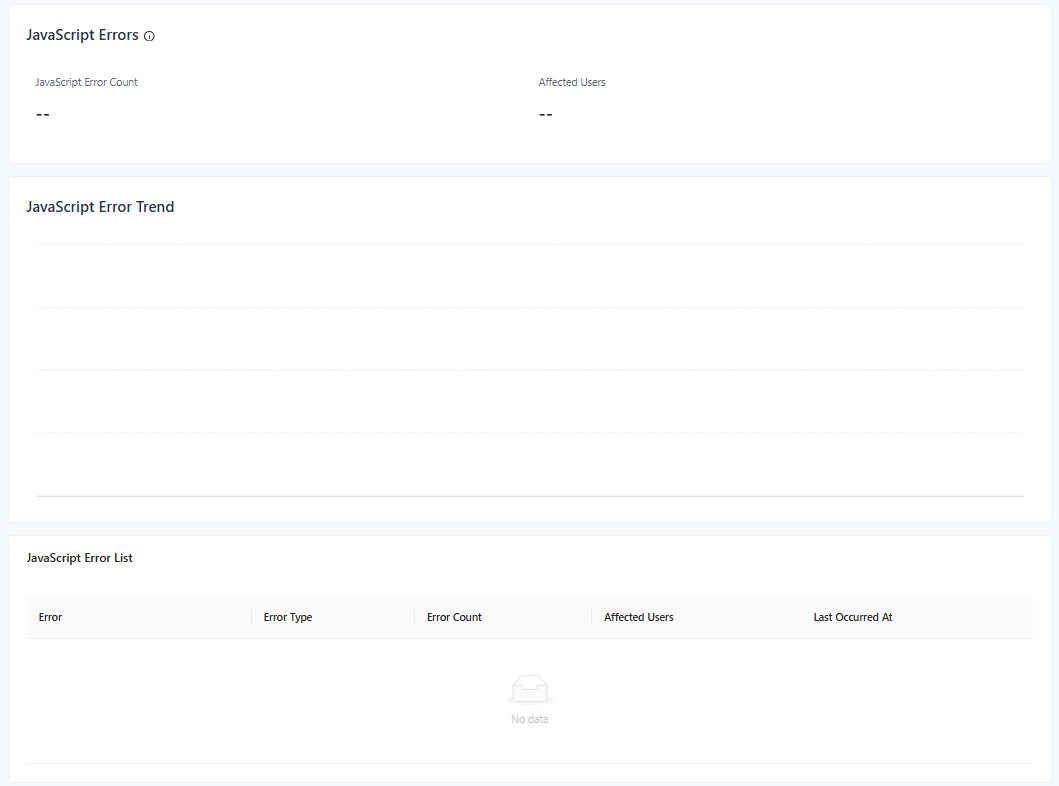
JavaScript errors are exceptions or failures that occur when the browser or mini program runtime parses or executes JavaScript code. They interrupt normal script executions and can break page features, trigger blank sections, or, in severe cases, lead to a white screen.

Figure 2. JavaScript Errors
Metrics
- JavaScript Error Count
- The total number of times a JavaScript error has occurred in your mini program over the selected time period.
- It gives you an immediate sense of how many JavaScript errors are happening across your mini program. By monitoring this metric, you can instantly see if a new release has introduced a major bug.
- Affected Users
- The number of UVs who have encountered at least one JavaScript error within the selected time period.
- This metric shows how many people were affected.
JavaScript Error Trend
The JavaScript Error Trend chart is a time-series line graph that visualizes how your JavaScript error metrics change over a selected period. Instead of looking at a single, static number, this chart allows you to see the dynamic behavior of your mini program's stability over time.
It transforms raw error data into a visual pattern, making it easy to spot patterns, spikes, and trends.
This chart is your primary tool for understanding the context and history of your mini program's stability.
- If you see a sudden, sharp spike in any of the error metrics, you can immediately correlate the date and time with recent events, such as a new version deployment, a configuration change, or a third-party service outage. This allows you to quickly identify the root cause of a problem.
- After deploying a fix for a significant bug, you can monitor this chart to check whether the fix takes effect.
The trend chart is an indispensable diagnostic and analytical tool that provides the context you need to understand, manage, and continuously improve the stability of your mini-program.
JavaScript Error List
The JavaScript Error List lists all the JavaScript errors that occurred in your mini program. It aggregates every unique error into a single, organized table, providing you with the critical data needed to diagnose, prioritize, and resolve issues efficiently.
Each record in the list represents a unique error, and each column provides information to help you understand its impact.
- Error
- The name of the error. You can click a specific error to navigate to the error details page.
- Error Type
- The category of the error. The type gives you an instant clue about the nature of the problem.
- Error Count
- The total number of times the specific error occurred during the selected time period. This metric measures the sheer frequency of an error.
- Affected Users
- The number of UVs who have encountered this error.
- It measures the reach of an error, telling you how many people are impacted. A bug with a high number of affected users is often more critical than one with a high error count but only a few affected users.
- Last Occurred At
- The most recent time when this error occurred.
- This tells you whether the bug is still active.
JavaScript Error Details
When you click on an error in the list, a details panel appears with deeper insights. This page shows the detailed information of a specific JavaScript error.
Page Details
This section provides charts that show the top 5 pages where this error occurs most frequently. You can switch the view between error count and affected users to see which pages are the biggest contributors to the problem. Hover over a bar to see the exact numbers.
Page Path
A list of all pages where the error occurred is provided below the Page Details chart section, sorted from highest to lowest frequency. Each path with error count and affected users is displayed.
Stack Trace
A detailed report that shows the exact sequence of function calls that led to the point where a JavaScript error occurred.
The stack trace pinpoints where the error occurred and provides the execution context, significantly speeding up debugging.
HTTP Errors
HTTP requests fetch fresh data, send user information, and implement functions of your mini programs. HTTP request failures can lead to missing content, broken features, and a frustrating user experience.
The HTTP Errors dashboard helps you detect, diagnose, and resolve these issues to maintain stability and reliability.

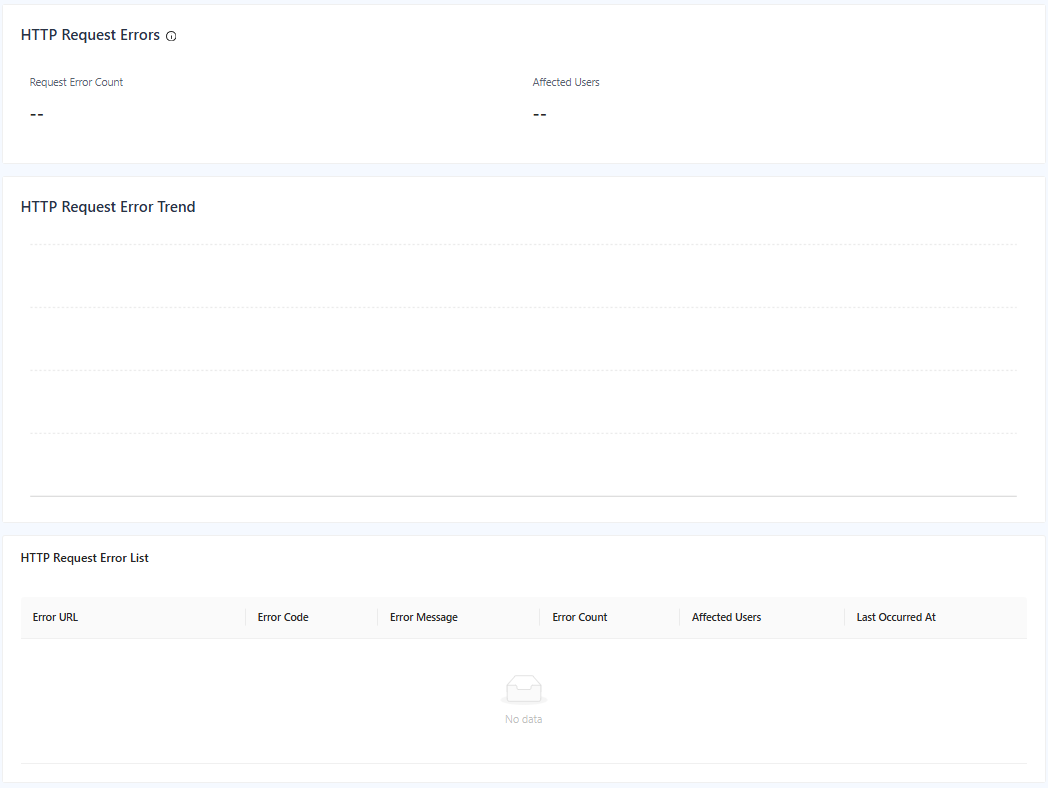
Figure 3. HTTP Errors
Metrics
This section provides a high-level, at-a-glance summary of HTTP requests. Key performance metrics are provided to help you quickly assess the current situation. In offline mode, each metric also includes a comparison to the previous day, allowing you to instantly spot recent changes.
- Request Error Count
- The total number of failed HTTP requests that occurred during the selected time period.
- This is a direct measure of the volume of failures.
- Affected Users
- The number of UVs who have experienced at least one failed HTTP request.
- This metric measures the reach of the problem. It helps you distinguish between an issue affecting one user repeatedly and a widespread problem impacting a large portion of your user base, which is often more critical.
HTTP Request Error Trend
The HTTP Request Error Trend chart is a time-series line graph that visualizes how the key metrics have changed over time. This tool transforms raw numbers into a clear visual chart, enabling you to spot patterns and anomalies instantly.
This chart helps you to:
- Pinpoint regressions: Immediately see if a new release or backend change caused a spike in errors.
- Verify fixes: Confirm that a deployed fix was effective by observing changes in the error metrics.
HTTP Request Error List
This list is your primary workspace for investigating and debugging specific HTTP request failures. The list aggregates all request errors, providing all the data you need to take action.
- Error URL
- The specific API endpoint that failed.
- Error Code
- The HTTP status code returned by the server.
- Error Message
- A descriptive message that provides more context about the failure.
- Error Count
- The total number of times this specific URL has failed with this specific error.
- Affected Users
- The number of UVs impacted by the failure.
- Last Occurred At
- The most recent time when the error occurred. This tells you if the issue is currently active and ongoing.
Resource Loading Errors
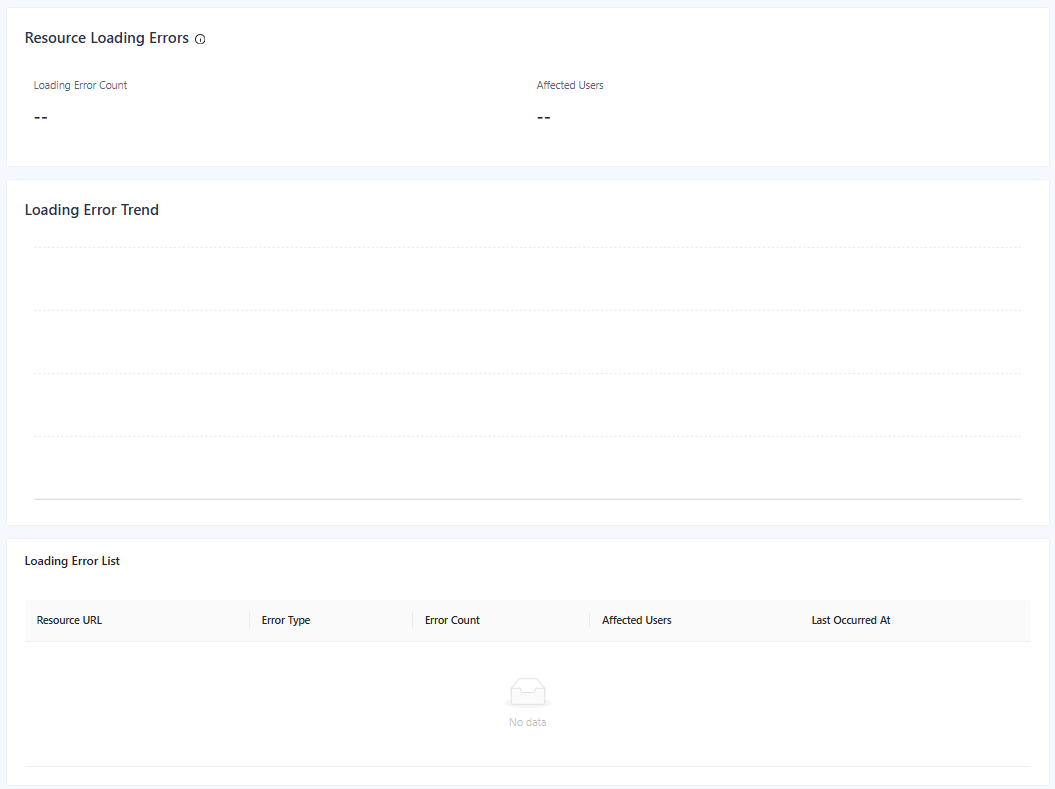
This page helps you monitor and troubleshoot resource loading errors across your mini program. The overview highlights key resource loading metrics, with day-over-day comparisons in offline mode to reveal regressions or improvements. A trend chart shows how these metrics change over time, making spikes and patterns easy to spot and relate to releases or configuration changes.
This page also provides detailed error listings to help you detect and address these issues quickly.

Figure 4. Resource Loading Errors
Metrics
- Loading Error Count
- The total number of failed resource load attempts in the selected time range.
- Affected Users
- The number of UVs who experienced at least one resource loading error during the selected time range. Each user is counted once.
Loading Error Trend
The Loading Error Trend chart visualizes how the key metrics change over the selected period. You can focus on spikes, dips, or gradual drifts to correlate issues with deployments, CDN incidents, or configuration changes.
In this chart, you can:
- Review trend lines for the above-mentioned metrics.
- See patterns that reveal when problems started, how long they lasted, and whether they are improving.
- Look for sudden spikes that align with releases or traffic surges.
- Compare peaks across metrics.
Loading Error List
This section provides a detailed list of specific resource loading errors so you can pinpoint exactly what is failing. Each row aggregates occurrences of the same issue to help you prioritize.
- Resource URL
- The resource URL where the loading error occurred.
- Error Type
- The category of failure.
- Error Count
- The total number of failed loading attempts for this specific error within the selected time range.
- Affected Users
- The number of UVs who encountered this specific error.
- Last Occurred At
- The most recent time when the error occurred. This tells you if the issue is currently active and ongoing.