Startup Performance
The Startup Performance tab gives you a focused view of how quickly and reliably users reach your mini program's first screen. The startup performance of a mini program is reflected through startup completion analysis and duration analysis.
Completion Analysis
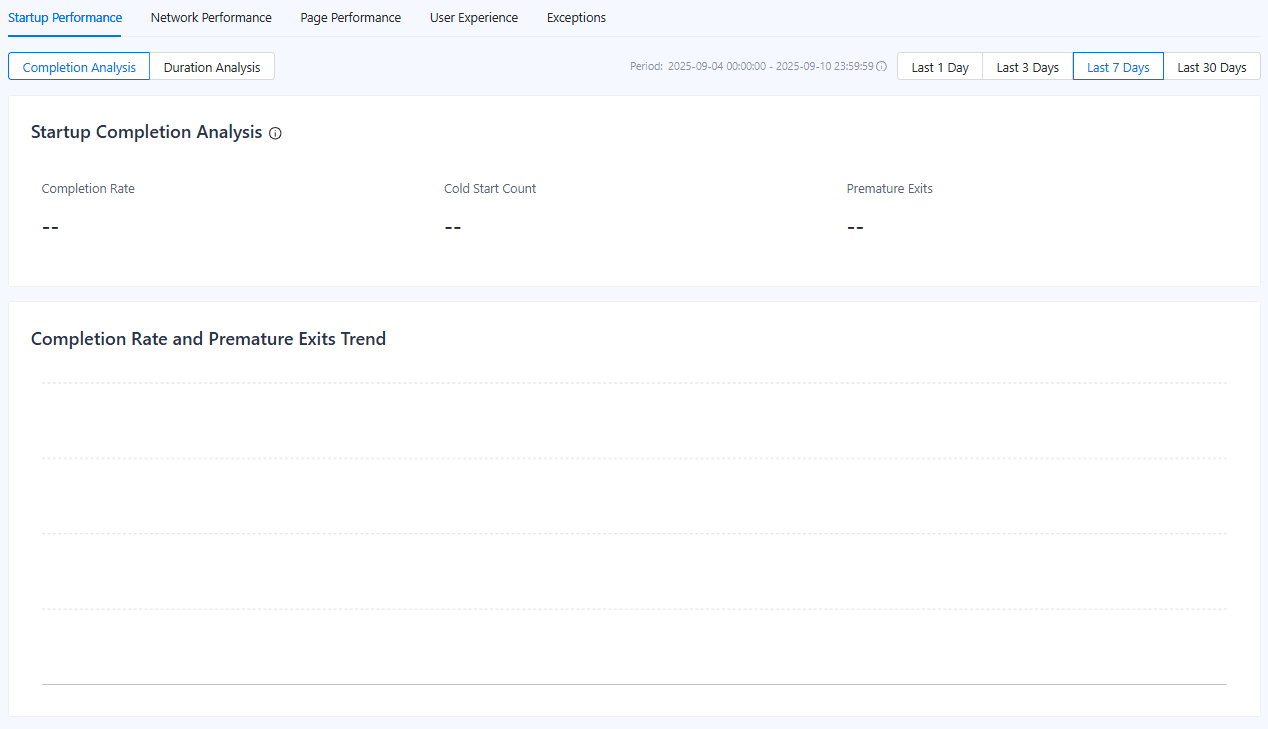
The Completion Analysis page tracks the success rate of launching your mini program, particularly during cold starts.
You can select a specific time period (last 1/3/7/30 days) to view data from the corresponding period.

Figure 1. Completion Analysis
Startup Completion Analysis
- Completion Rate
- The percentage of cold starts that successfully render the first page. This is the primary indicator of launch stability.
- A high rate means your mini program is stable. A sudden drop may signal a critical launch-blocking bug.
- Cold Start Count
- The total number of cold starts. A cold start occurs when a user opens the mini program for the first time or after it has been fully closed.
- This metric provides context for your open rate and helps you understand your launch volume.
- Premature Exits
- The number of times users abandon the mini program during cold starts before the first screen finishes rendering.
- A high abandonment rate indicates that users abandon the experience before the first page loads, often out of frustration.
Note: To help you immediately understand performance trends, each key metric includes a comparison to the previous day. This allows you to instantly see whether your mini program launch performance is improving, declining, or holding steady.
Completion Rate and Premature Exits Trend
The trend chart provides a clear visualization of the startup success rate and abandonment of your mini program over the selected period. By plotting these two critical metrics together, you can instantly view the performance of your mini program's startup.
A sudden spike in abandonment that corresponds with a drop in the completion rate is a strong indicator of a critical startup issue. You can fix the issue based on the corresponding time points.
Duration Analysis
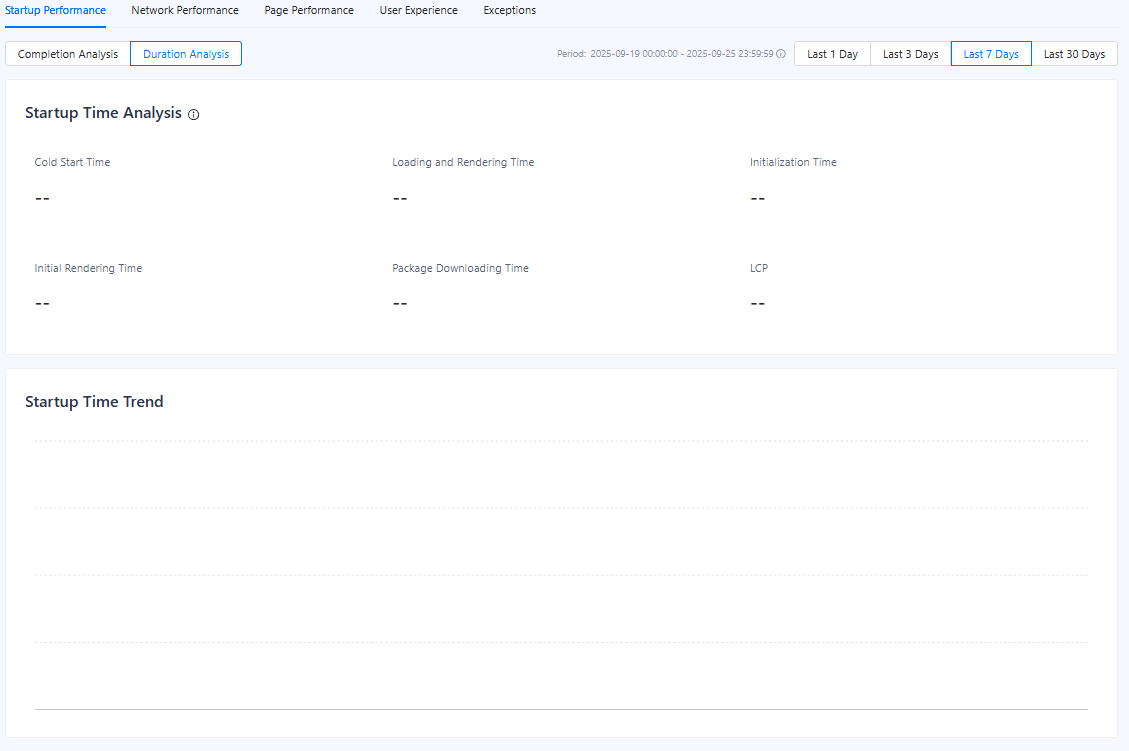
The Duration Analysis section breaks down startup time into separate phases, helping you find bottlenecks and optimize performance. You can select a specific time period to view data from the corresponding period.
The metrics help you identify the most time-consuming phases and optimize your code and structure accordingly. You can select a specific time period (last 1/3/7/30 days) to view the data in the corresponding period.

Figure 2. Duration Analysis
Startup Time Analysis
- Cold Start Time
- The average total time from a user tapping your mini program icon to the first screen being fully rendered.
- Loading and Rendering Time
- The time from when the basic resources are ready to when the first page is visually complete. A long loading and rendering time could point to complex UIs, large local data processing, or inefficient rendering logic.
- Initialization Time
- The time it takes for the mini program's environment to be set up and ready for execution after it is launched. This includes the time it takes to initialize the runtime, such as setting up memory and allocating resources, and configure necessary settings, such as network connections or API keys.
- Initial Rendering Time
- The time from when a user opens the mini program to when the first page is painted.
- It matters because it directly affects user perception, retention, and conversion. Slow first renders make users drop off.
- Package Downloading Time
- The time it takes for a mini program to download its packages, such as the code and resources, from the server to the user's device during cold starts. This metric measures the duration from when the download request is sent to when the package is fully downloaded and ready for execution.
- A short package downloading time is crucial for a good user experience, as it directly affects how quickly the program can start rendering content and responding to user interactions.
- LCP
- The time it takes for the largest visible piece of content in the viewport to render.
- This is a crucial user-centric metric for perceived loading speed. A fast LCP improves perceived responsiveness, even if other parts are still loading in the background.
Note: To help you immediately understand performance trends, each key metric includes a comparison to the previous day. This allows you to instantly see whether your mini program launch performance is improving, declining, or holding steady.
Startup Time Trend
The startup time trend chart visualizes the essential startup performance metrics tracked over the specified time period. This visualization provides comprehensive insights into the mini program's startup performance characteristics.
You can use the trend chart to track the startup time change trend and monitor the time consumed in each phase of startups.