Overview
The Report dashboard of the Mini Program platform displays performance data of mini programs. It helps you track, prioritize, and fix stability issues that erode the quality of your mini programs. You can view the performance data and improve the quality of your mini programs for enhanced user experience based on the data.
The dashboard provides an overview of key metrics, including startup time, network failures, page performance, and runtime errors. You can use the data to monitor the health of new releases, investigate user-reported issues, and prioritize fixes based on impact.
This guide helps you understand the metrics and improve the quality of your mini programs based on the metrics data.
Glossary of terms
- Cold start: Launching a mini program when it is not already running in the background. This requires loading all necessary resources from scratch.
- Largest contentful paint (LCP): A user-centric metric measuring the time until the largest image or text block becomes visible. It's a key indicator of perceived speed.
- Page view (PV): An instance of a page being loaded in the mini program.
- Unique visitor (UV): A single, distinct individual interacting with your mini program.
Getting started
To view quality metrics of mini programs, perform the following steps:
- Log on to the Mini Program platform.
- In the left navigation panel, choose Quality > Report.
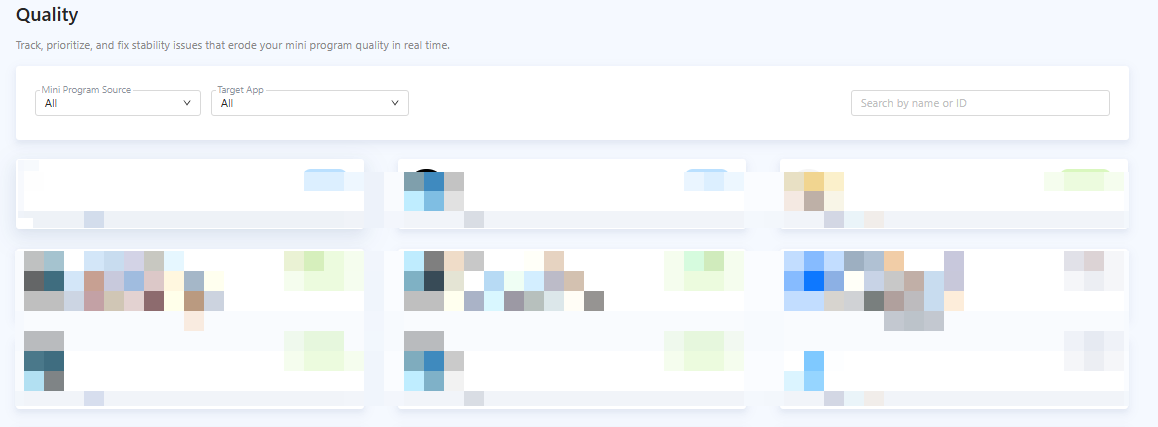
- In the displayed mini program list, you can filter mini programs by source and target app, or search a mini program by name or ID.
- Click the mini program that you want to view. The mini program report page is displayed.
- On the displayed mini program quality metrics page, you can filter the mini program by environment and version.

Figure 1. Report page
The Quality page contains the following tabs: Startup Performance, Network Performance, Page Performance, User Experience, and Exceptions. Each tab displays quality metrics of the mini program from different perspectives.
- Startup Performance: shows the startup analysis data of a mini program, especially in cold starts.
- Network Performance: displays key performance indicators for network reliability and monitors the health of your mini program's network calls.
- User Experience: focuses on issues that affect the user experience, especially the impacts of white screen issues.
- Exceptions: shows exceptions of your mini programs, including JavaScript errors, resource loading failures, and failed HTTP requests.